I optimize WordPress sites for a living - retainers and one-off rescues. And there's one thing I find on client site after client site, usually while I'm hunting down why the thing is slow: a wp-content/debug.log that's 5 GB. Sometimes more. Enabled months ago, never turned off, quietly growing a few hundred bytes at a time on every single request.
It's a strange file to feel two ways about. On one side it's a mine of information - every slow query, every deprecation, every PHP warning the site ever threw is in there. On the other side, sifting through 5 GB of crap to find the useful part takes ages, and half the time the disk is one bad day away from filling up because of it.
So a WordPress debug.log too large to even open is one of those failures that stays invisible right up until it takes the whole site down. And WordPress has no built-in way to cap that file, rotate it, or collapse the duplicates. It just keeps writing.
I built a module to deal with it: Debug Log Guard. It shipped in WP Multitool 1.5.0, and this is what it does and - just as important - what it doesn't.
Why this happens
When WP_DEBUG_LOG is truthy, WordPress points PHP's error log at wp-content/debug.log and PHP does the appending. That's it. There's no size limit, no dedup, no rotation. PHP wasn't designed to babysit the file - it just writes what you tell it to.
So a single noisy plugin firing E_DEPRECATED on every request is enough. The line is identical each time except for the timestamp. Most of that giant file is one error, copied a hundred thousand times over.
And here's the part that makes it worse: once the file is big, you can't even look at it. Open a 4 GB log in a text editor and you'll OOM your laptop. cat it on a 256 MB VPS and you might knock the box over. The tool you'd normally reach for to diagnose the problem becomes part of the problem.
What everyone actually does about it
Before I built this I asked around in r/WordPress - how do people deal with a debug.log that's eaten the disk? The answers were honest and they all fell into two camps.
Camp one: delete it. "Just disable WP_DEBUG and delete the file." "Force the site to error and let it produce fresh ones." That works, and I get why people do it. But you're throwing away the only record of what's been going wrong. If a bug only fires in some specific case, you've just signed up to reproduce it from scratch, and you won't know it's gone until it isn't.
Camp two: feed it to AI. "Paste it into Claude and ask for a summary." Good instinct - except a 5 GB file doesn't fit in any context window. So it collapses back into "just feed in today's slice," and you're back to guessing which slice matters.
The few people with a real answer reached for server tools - logrotate, or a cron that runs truncate weekly. That caps the size, but it's still lossy and it lives outside WordPress, so most site owners never set it up.
What none of these do is the hard part: read a multi-gigabyte file without falling over, and shrink it safely without losing the errors you need. That's the gap. Viewers that read the log and show distinct errors with a count already exist, some are free, and grouping-on-display is table stakes now - I'm not going to pretend that part is hard. The hard part nobody handles well is reading a multi-gigabyte file without falling over, and shrinking it safely without losing the errors you actually need. That's where I put the work.
What Debug Log Guard actually does
Three things.
It reads the log without loading it into memory. Everything streams in bounded chunks. The grouped summary, the tail view - none of it pulls the whole file into RAM. So a 4 GB log on a small box doesn't crash the very tool you're using to fix it. For a genuinely huge file it scans the most recent slice and tells you it's showing a partial view, instead of hanging.
It groups the repeats so you see the real culprit. It strips the timestamp, hashes what's left, and counts. Instead of scrolling through 200,000 identical lines, you get a table: the message, how many times it fired, which plugin or theme it came from, and when you first and last saw it. The worst offender sits at the top. At a glance you know whether you have one screaming plugin or twenty small leaks.
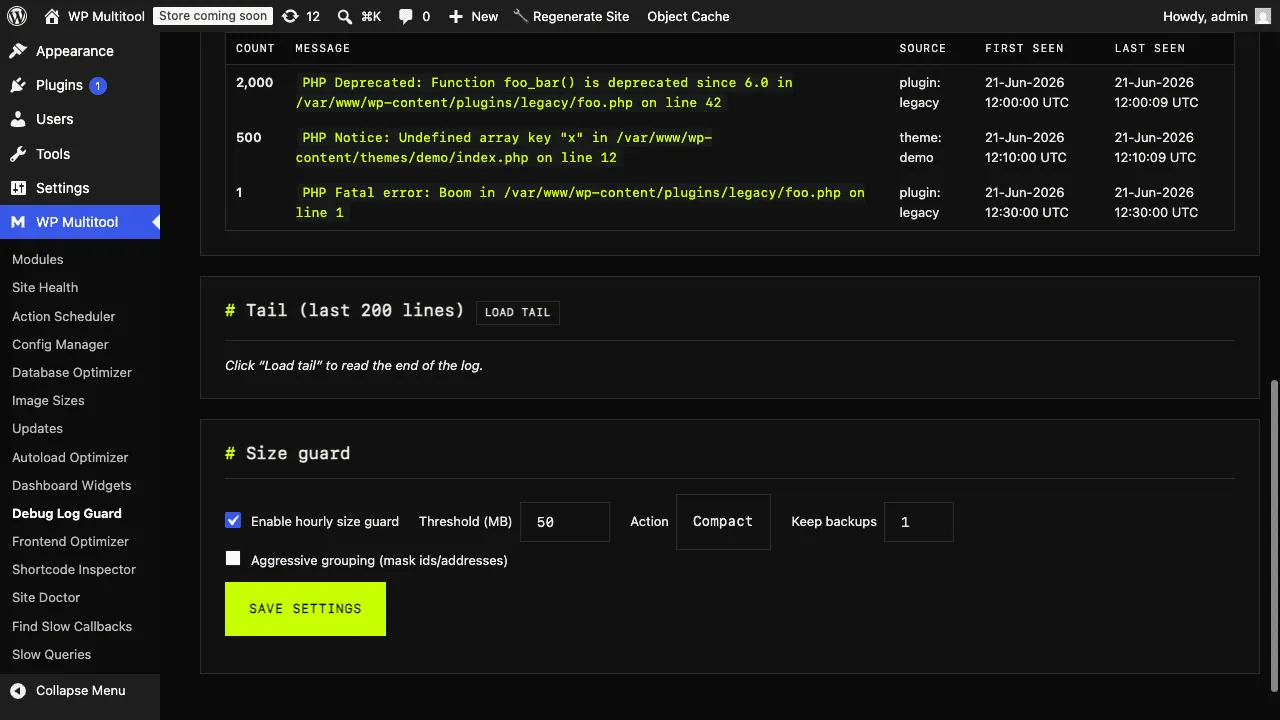
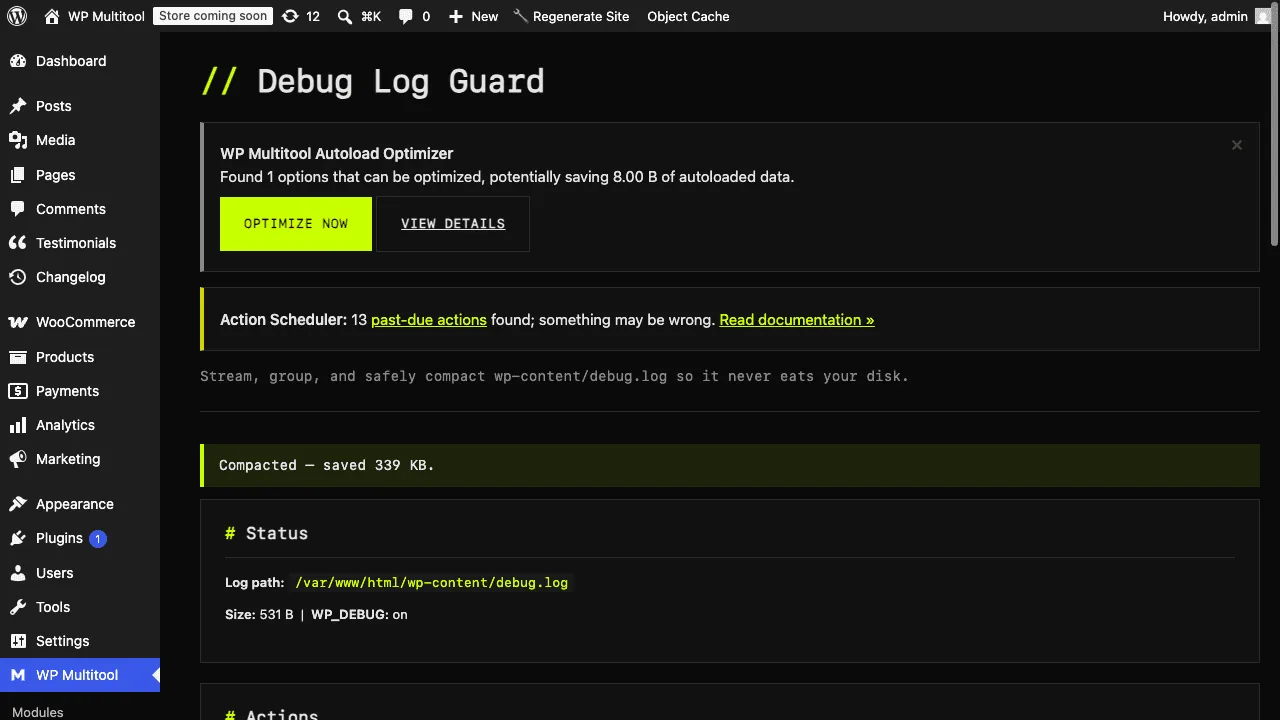
It compacts the file safely. This is the bit I care about most. Compact collapses every repeated line into one annotated entry - it keeps the message, replaces the 50,000 copies with a [compacted x50000] note, and preserves the warnings and fatals you'd actually want to keep. In my tests a 404 KB spam log came out at 301 bytes. A 340 KB one came out at 531 bytes. The same errors, minus the tens of thousands of identical repeats.
Every write is backup-first. It copies the log aside before it touches anything, writes the compacted version to a temp file, and swaps it in atomically. If anything fails mid-way, the original is untouched. I'd rather refuse to act than half-rewrite your log.
There's also a size guard - an hourly check that watches the file and, when it crosses a threshold you set, compacts or rotates or clears it for you. The check itself is cheap. It only reads the file size, never the file, so the guard can't be the thing that slows you down.
The giant-log case, specifically
The dangerous moment isn't the 50 MB log. It's the one that's already several gigabytes before you ever install anything. Naively "just compact it" and you can run out of disk writing the temp copy, or time out halfway. That's the second outage.
So there are guards for that exact situation:
- Before compacting, it checks free disk. If there isn't enough room for the temp file, it refuses and tells you to rotate or clear instead - those need almost no extra space.
- Past a hard ceiling, it won't auto-compact at all. It rotates instead, because compacting a multi-GB file under a cron time limit is the risky path.
- Compaction runs against a time budget. If it would blow past it, it aborts and leaves the original file exactly as it was.
None of that is glamorous. But it's the part that keeps a cleanup from turning into a second outage.
One detail most tools get wrong
WP_DEBUG_LOG doesn't always mean wp-content/debug.log. It's a constant with three states, and WordPress only wires up file logging when WP_DEBUG is actually on. If WP_DEBUG is off, logging falls back to whatever php.ini's error_log points at - which might be a custom path, or /dev/stderr, or nothing.
I verified this across PHP 7.4 through 8.5 while building the module. So Debug Log Guard resolves the real active target instead of guessing. If it's pointed at something it can't safely manage, like /dev/stderr, it tells you and disables the destructive actions rather than doing something dumb. It's a small detail, but it's the kind of thing I check for before I trust a tool with my logs.
If you want to flip WP_DEBUG or WP_DEBUG_LOG itself, that lives in Config Manager - I didn't want two different parts of the plugin both writing to wp-config.php.
The warning you shouldn't have needed
Out of everyone I asked, one person said the thing that actually matters: why is the debug log enabled on a production environment at all? Everyone else was fighting the symptom. That one question is the root cause.
A 5 GB debug.log almost always means logging got switched on to chase a bug, and then nobody switched it off. So it kept writing. On production. Where it costs you a little performance on every request, and where a debug.log sitting in wp-content can be reachable straight over HTTP - which means it's quietly handing out your file paths, plugin versions, and stack traces to anyone who guesses the URL.
So Debug Log Guard checks for exactly that. If WordPress reports the site as production and debug logging is on, it shows you a plain warning - in the admin screen and in the CLI. Not buried in a settings tab. Right at the top, where you'll see it.
That's really the whole point of WP Multitool. A lot of what's wrong with a WordPress site is already knowable - it's sitting in a constant, a file permission, an autoload row, a log. It's just obscure enough that nobody looks. The job is to drag that stuff into the open.
From the command line
If you live in the terminal - and if your disk just filled up, you probably do right now - it's all there in WP-CLI:
wp multitool debug-log status

wp multitool debug-log summary

wp multitool debug-log compact

wp multitool debug-log clear
That works even when wp-admin is unreachable, which is exactly when you need it. If you don't know the rest of the wp multitool commands, I wrote up the WP-CLI commands I reach for most.
If you run a lot of sites
This is really written for the people I do this work alongside - freelancers and small agencies maintaining a stack of client sites. When a small blog you look after quietly runs its disk out of space because of a 5 GB debug.log, the first you hear about it is a support ticket from a confused client whose site is down. That's the worst way to find out.
So 1.5.0 also adds a command built for exactly that:
wp multitool healthcheck

wp multitool healthcheck --format=json
It's fast - no network probes, just the cheap high-signal checks: is debug logging on in production, is the log ballooning, is autoload bloated. The point is the exit code. Drop it in a cron on every site:
wp multitool healthcheck || notify-me "$(hostname) needs a look"and you find out a site is heading for trouble before your client does. That's the whole job - know what's wrong before it becomes a ticket.
What it doesn't do
I said I'd be honest, so:
It doesn't stop the errors at the source yet. Right now it cleans up after the fact - it reads and compacts. Preventing the duplicate writes before they ever hit disk is a harder, riskier piece of work, and I'm not going to ship it until I'm sure it can never swallow a real fatal error. When it's ready, it's ready.
It also doesn't fix the plugin that's spamming you. It tells you which one it is. The fixing is still on you - though now you'll actually know where to look.
And the dedup-on-display part, like I said, isn't unique. The safe compaction, the size guard, and the giant-log handling are the reasons to use it.
Where it fits
Debug Log Guard is part of the WP Multitool Pro modules, alongside Site Doctor for the misconfigurations you can't see and the rest of the rescue toolkit. It's the module you'll be glad is already installed the next time you read what to do when your site goes down and the answer turns out to be "the disk is full of one repeated error."
A debug log is there to help you find problems. Mine kept quietly filling disks instead, so I built the thing I wish I'd had on those 3am calls. It shipped in WP Multitool 1.5.0.