
The problems that don't show up anywhere
The site loads. Nothing is on fire. And yet OPcache is thrashing because its key table is full, so PHP recompiles on half your requests. There's an object-cache.php drop-in still pointing at a Redis server that died three months ago, quietly erroring on every page. The homepage misses the page cache on every single hit and nobody noticed, because it still renders, just three seconds slower than it should. Most of what slows a WordPress site down is invisible from the dashboard.
I fix real client sites for a living, and the same handful of misconfigurations come up again and again. They're never in the obvious place. You find them by SSHing in, reading opcache_get_status() by hand, curling your own homepage to read the cache header, squinting at wp_options. Every time. So I turned that checklist into a module. It's called Site Doctor, and it's the headline of 1.4.
What the WordPress Site Doctor health check does
Site Doctor is an on-demand WordPress health check that scans five production misconfigurations WordPress hides from you (OPcache state, a dead object-cache drop-in, LiteSpeed misconfiguration, page-cache misses, and WooCommerce gateways stuck in test mode) and hands you the exact fix for each one.
You click Run scan (or run wp multitool doctor from the command line) and it checks the things that actually cost you, then tells you how to fix each one. It's read-only and it never runs on a normal page load. The scan fires once, when you ask it to, and caches the result. It's a diagnostic tool you reach for, not another thing bolted to every request.
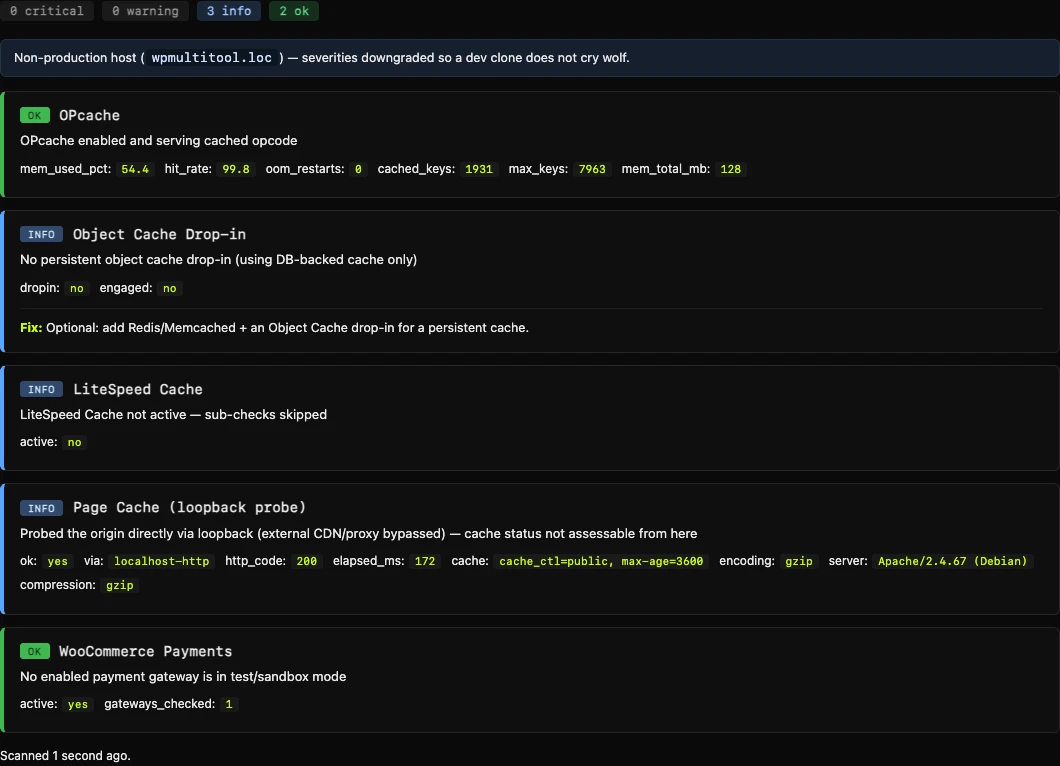
Here's what it looks at:
- OPcache health. Not just on or off. It catches the states that actually hurt: out-of-memory restarts, a full key table forcing recompiles, a populated cache with a low hit rate. When something's wrong it hands you a sized
php.inisnippet calculated from your live numbers, not generic advice. - The object-cache drop-in. A present-but-dead drop-in (the file is there, the backend isn't answering) is flagged critical, because that's the silent killer: it can error on every request while the site still limps along. It identifies the vendor and tells you the safe move.
- Page caching, via one real loopback request. It fires a single request at your own homepage and reads the cache header. HIT or MISS, LiteSpeed or Cloudflare or Varnish or Kinsta. A cache layer that's present but missing on every hit is worth knowing about.
- LiteSpeed misconfiguration detection for sites running LSCWP, the kind of thing that silently stops LiteSpeed from caching even though the plugin is active.
- WooCommerce payment gateways stuck in test mode. A live shop with a gateway still in sandbox can't actually take money. It catches the enabled-but-test-mode gateways (including the Przelewy24 wizard bug that saves a localized label instead of "production") so you find out before a customer does.
It deliberately does not duplicate what other modules already do well: cleaning expired transients and chasing down overdue cron live in the Database Optimizer and the Site Health view. Site Doctor sticks to the configuration problems nothing else surfaces.
Detect and fix, not just a wall of red
I have a rule for Site Doctor: a check isn't allowed to ship unless it comes with a fix. Finding a problem and shrugging is what most "health check" tools do, and it's useless when you're tired and just want the site fast again.
So every finding carries remediation. Not "consider tuning your cache", but the actual change to make, with the real values. OPcache flags a problem and hands you a sized php.ini snippet calculated from your live numbers. A gateway in test mode tells you the exact setting to flip. I don't want a plugin auto-changing this stuff behind your back from PHP. Flipping a payment gateway live is your call, not the scanner's. So the fix is concrete guidance you act on, not a button that guesses.
One more thing I care about: it doesn't cry wolf on your laptop. Site Doctor has a staging-guard that quietly downgrades severities on dev hosts (.loc, .local, staging. subdomains, and so on). A dead object cache on your local clone is expected. On production it's critical. Same check, different stakes, and the tool knows the difference.
Site Doctor ships enabled out of the box. It's admin-only and adds nothing to a page load, so there's no reason to hide it.
And when wp-admin won't even load
Site Doctor assumes you can reach the dashboard. Sometimes you can't, and that's the other half of 1.4: a small WP-CLI rescue kit for when wp-admin is the thing that's broken. Usually it ran out of memory, because the dashboard is the heaviest page on the site.
The number-one cause of that is a bloated autoload set, the options WordPress loads into memory on every request. Plugins you deactivated months ago leave megabytes of it behind. Three commands, in the order you'd use them:
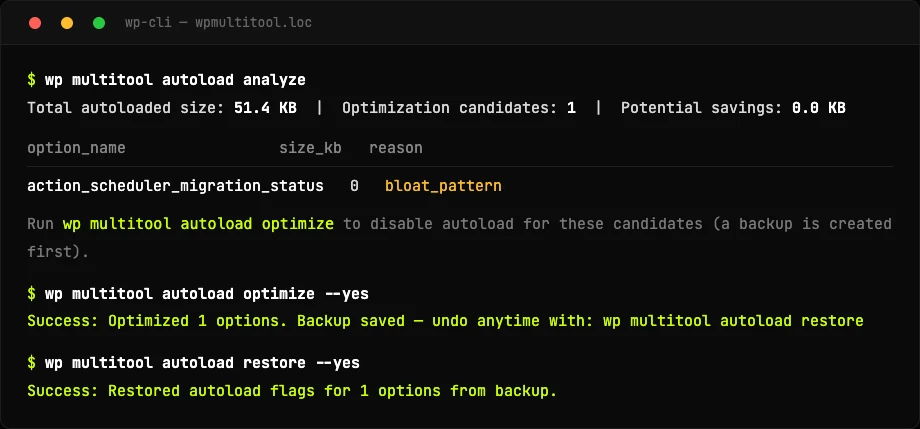
wp multitool autoload analyze classifies every autoloaded option and flags the safe-to-trim ones, specifically the leftovers from plugins that aren't active anymore. optimize disables autoload for those, after writing a backup. restore puts every flag back exactly as it was and reports the exact count, so if it didn't help you're one command from where you started. There's also wp multitool modules to enable and disable modules from the command line when you can't reach the toggles.
I'll be honest about the autoload win, because the internet oversells it. It mostly moves TTFB on sites with a big autoload set and no persistent object cache. On Redis or Memcached the blob is already cached and the gain shrinks to memory. On a query-bound site the real problem is usually the queries, which is the last new tool.
Catch an N+1 query storm in one page load
The classic WordPress performance killer is the N+1 query: a plugin runs the same query once per item in a loop, so a page with 50 products fires 50 near-identical queries instead of one. Finding these usually means leaving query logging on and digging, which you don't want running on a live site.
1.4 adds a one-shot probe. wp multitool slow-queries probe fires a single request at your front end with query logging on for that one request only, gated behind a one-time token, then switches logging straight back off.
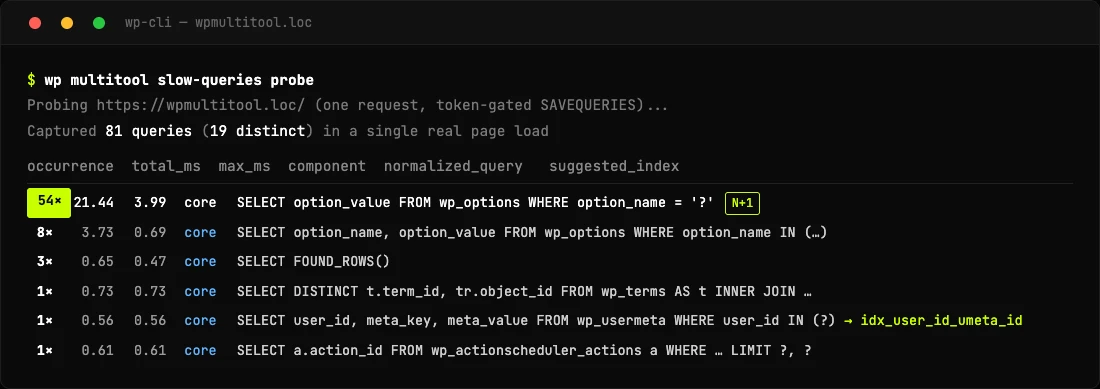
That 54× in the first column is the whole point. One query running 54 times on a single page load is an N+1 waving its arms at you, and where an index would help, the probe hands you the exact CREATE INDEX statement.
Less overhead out of the box
- The profiling modules now ship off. On a fresh install, the Slow Query Analyzer and Find Slow Callbacks start disabled. They're diagnostic tools you reach for when hunting a problem, so a fresh install adds no per-request profiling cost until you turn one on. Existing sites keep whatever you already had.
- A low-memory warning now fires in the health checks and CLI when your configured memory limit is low, with the exact constant to raise in
wp-config.php. Better to know before the dashboard dies, not after.
The safety net that can't be switched off by accident
One hardening note. WP Multitool's Fatal Error Recovery, the thing that gets you back into a white-screened site, is now a deliberate always-on safety net. It's no longer owned by any toggleable module, so disabling modules (from the dashboard or the new CLI commands) can never strip a site of its crash recovery. The one feature you'd most want during an outage is the one you can't turn off by mistake.
The point
Site Doctor is the part of this release I'm most happy with, because it's the checklist I actually run on real sites, turned into one button. Most WordPress tooling tells you a site is "healthy" when it loads. The interesting problems are the ones that don't announce themselves: the dead cache, the thrashing opcode cache, the query fired fifty times. 1.4 is about finding those, and fixing them.
WP Multitool 1.4 is available now, and existing license holders get it through the in-plugin updater, no re-download needed. New to it? You can get WP Multitool, or skim the full 1.4 changelog for everything that shipped.