What Site Doctor Is
WP Multitool's Site Doctor is an on-demand WordPress scan that ranks what's slowing the site — config, Redis object-cache health, page-cache probe, database bloat, and (on Pro) autoload and captured slow queries — then links each finding to the module that fixes it. It runs locally when you ask, never on every page load.
It exists because "my WordPress is slow" is not one question. It is a dozen questions that normally get answered one plugin at a time, in whatever order you happen to think of them. Site Doctor asks all of them in a single pass and puts the answers in order of how much they cost you.
It is not a replacement for Query Monitor, WordPress Site Health, or a caching plugin. Those answer different questions, and Site Doctor says so where the honest answer is "use the other tool first."
What It Checks
One scan pulls from two places: Site Doctor's own configuration checks, and the modules that already measure something worth ranking. Where a source is missing on your edition, the scan names it instead of quietly dropping it — a short list of findings is never mistaken for a clean site.
Site Doctor's own checks (every edition)
- OPcache — enabled and healthy: hit rate, out-of-memory restarts, key table saturation. Hosts that restrict the status API are reported as restricted, not as "off".
- Object-cache drop-in — whether
object-cache.phpis actually engaged. A drop-in pointing at a dead backend is flagged critical. - Redis — 21 object-cache checks that read the server's running configuration instead of inferring health from a successful connect.
- Page cache — a loopback HTTP probe of your own homepage that reads the real cache headers, and reports "probe not possible" rather than guessing when the host blocks loopback.
- LiteSpeed Cache and overlapping optimizer plugins — two plugins both stripping emoji scripts or both removing jQuery Migrate is a common, invisible cause of doing the same work twice.
- WooCommerce gateways — enabled payment gateways still sitting in test or sandbox mode, where real customers cannot pay.
- Staging guard — localhost,
.loc/.test/.localandstaging.hosts get severities downgraded. A dev clone without a page cache is normal, not an emergency.
Sources pulled from other modules
| Scan source | Owned by | Lite ($9) | Pro |
|---|---|---|---|
| Config, OPcache, object cache, 21 Redis checks, page-cache probe, LiteSpeed, overlaps, Woo gateways | Site Doctor itself | Yes | Yes |
| Database bloat (revisions, expired transients) | Database Optimizer | Yes | Yes |
| Action Scheduler junk (completed rows) | Action Scheduler Optimizer | Yes | Yes |
| Autoload burden, oversized and orphaned options | Autoloader Optimizer | No | Yes |
| Captured slow queries | Slow Query Analyzer | No | Yes |
Site Doctor itself is not a Pro module — it ships in Lite, with its own checks intact. What Pro adds is two more scan sources, because the modules that produce them are Pro modules. The shipped Lite readme says it in one line: "Site Doctor — One scan that finds what is slowing the site down. The Full Version adds two more scan sources: autoload and slow queries."
Site Doctor vs Site Health vs Query Monitor
These three get confused constantly, and they should not be. They answer different questions, and on a site with a real problem you will probably use more than one.
| Comparison criterion | Site Doctor | WordPress Site Health | Query Monitor |
|---|---|---|---|
| Question it answers | Where do I start on this whole site? | Does this install meet core's own checklist? | What happened inside this one request? |
| Scope | Whole site, on demand | Whole site, core criteria | A single page load |
| Object cache depth | 21 Redis checks past the handshake | Present / not present | Per-request hit and miss counts |
| Output | Findings ranked worst-first, each linked to the module that fixes it | Pass / recommended list | Raw panels: queries, hooks, HTTP calls, timings |
| Price | Paid, from $9 (Lite) | In WordPress core | Free on wordpress.org (~200,000 installs) |
If you want a free plugin, or you need to debug one specific request, install Query Monitor. If the front end is slow for anonymous visitors, a caching plugin comes first. Site Doctor is for the case where the front is already cached and the backend still hurts — slow wp-admin, bad TTFB, Redis reporting Connected while nothing got faster, or an agency that needs one ranked scan on intake.
"Connected" Is Not "Working"
Almost every Redis check in the WordPress ecosystem opens a socket, sends a PING, gets a PONG, and reports green. That test cannot fail the ways Redis actually fails.
A server can answer PING instantly while it is rejecting every write because it hit its
memory ceiling under a noeviction policy; while it is discarding keys as fast as WordPress
writes them; while it is serving another site's data from a shared keyspace with no prefix; while the
options group sits on the ignore list, so the one thing worth caching is the one thing not
cached; or while the round-trip cost of a hundred lookups per page exceeds the database work it saves.
Site Doctor's 21 checks read the server's running configuration instead. They are
read-only and run only when you scan — INFO, CONFIG GET,
DBSIZE and one bounded SCAN, never KEYS. Where a host blocks
CONFIG GET (Kinsta, WP Engine and Cloudways among them) the affected checks say "cannot
verify this here" and never "ok". No data is not the same as no problem.
The whole argument, with the measurements behind it: Redis says Connected. Your site is still slow.
How It Works
- Scan — click "Find what's slow", or run
wp multitool quickstartfor the same whole-site ranked list.wp multitool doctorprints Site Doctor's own checks only (OPcache, Redis, the page-cache probe). Nothing scans on page load; the button always forces a fresh run. - Ranked findings — every finding gets a severity (ok / info / warn / critical), an explanation of why it matters, and the raw numbers behind it. Worst first.
- Open the module — each finding links to the module that owns the fix, with the exact values to set: php.ini directives, the
redis.confline, theWP_REDIS_*constant. - Safe optimize — a separate, explicit action. On Lite it clears expired transients and old completed Action Scheduler rows. Clearing autoload leftovers from inactive plugins needs the Pro Autoloader Optimizer.
- Re-scan — run it again to confirm the finding turned green. The Redis eviction rate needs two scans a minute or more apart, because the counter it reads is cumulative since boot.
The scan itself is read-only. It never edits configuration, files, or the database, and every recommendation is something you apply deliberately.
$ wp multitool quickstart
$ wp multitool quickstart --format=json
$ wp multitool doctor
$ wp multitool redis --force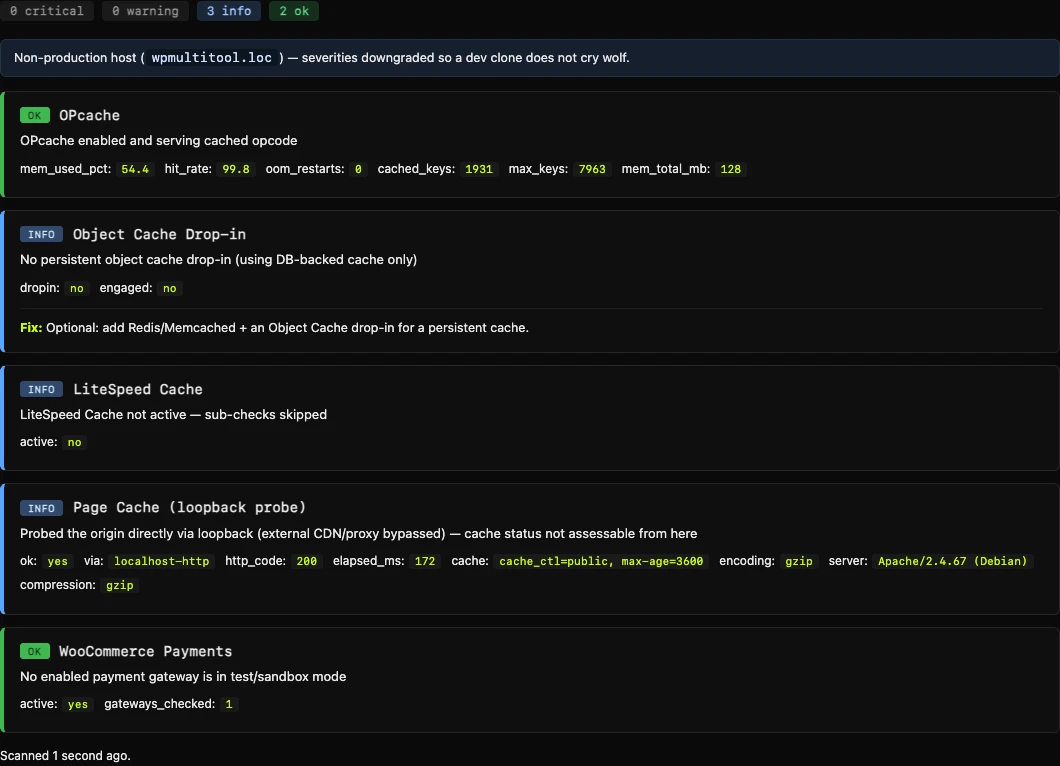
Try Something Free First
WP Multitool is paid and is not on wordpress.org. Before you spend anything, the free scanner measures your site from the outside: TTFB, compression, page size, and whether it is WordPress. It takes a URL and no install.
It does not run Site Doctor's checks. Nothing outside your server can see OPcache, your object-cache drop-in, Redis configuration, autoload weight, or the Action Scheduler table. The external scan tells you whether the front door is slow; Site Doctor tells you why the house is.
And if you just want a free plugin in the dashboard, install Query Monitor. It is free, it is excellent, and it is the right first answer to "debug this one request". I would rather say that here than have you buy the wrong thing.
FAQ
- What is Site Doctor?
- WP Multitool's Site Doctor is an on-demand WordPress scan that ranks what's slowing the site — config, Redis object-cache health, page-cache probe, database bloat, and (on Pro) autoload and captured slow queries — then links each finding to the module that fixes it. It runs locally when you ask, never on every page load.
- Is Site Doctor a separate plugin?
- No. Site Doctor is a module inside WP Multitool, and it is present in every edition including Lite. You install WP Multitool; Site Doctor is the screen new installs land on after activation.
- Does Site Doctor replace WordPress Site Health?
- No, it complements it. Site Health is part of WordPress core and reports on core's own checklist. Site Doctor is an on-demand ranked scan of backend performance — OPcache, the object-cache drop-in, 21 Redis checks, a page-cache loopback probe, LiteSpeed, overlapping optimizer plugins, WooCommerce gateways, database bloat and Action Scheduler junk — and each finding links to the WP Multitool module that fixes it. The scan is read-only by default. Run both.
- Does Site Doctor replace Query Monitor?
- No. Query Monitor is the right tool when the question is "what happened in this one request" — it breaks a single page load down into queries, hooks and HTTP calls. Site Doctor answers a different question: "where do I start on this whole site." If you need to debug one request, use Query Monitor. If you want one scan of a site, or the admin is slow, or Redis says Connected and the site is still slow, start with Site Doctor inside WP Multitool. Many people run both.
- Redis says Connected but the site is still slow — what now?
-
Connected only proves the socket opened. Site Doctor runs 21 Redis object-cache checks
past PING: eviction policy and rate, memory headroom, key prefix collisions on a shared instance,
ignored cache groups, and topology. Where
CONFIG GETis blocked by the host, those checks report "unknown" rather than passing.wp multitool redisprints the same report from the command line. - Does Site Doctor change the site when I scan?
-
No. The scan is read-only and runs only when you ask for it — the "Find what's
slow" button,
wp multitool quickstartfor the whole-site ranked list, orwp multitool doctorfor Site Doctor's own checks. It does not run on every page load. Changing anything is a separate action: safe optimize can clear expired transients and old completed Action Scheduler rows on Lite and above, while clearing autoload leftovers from inactive plugins needs the Pro Autoloader Optimizer module. - What does Site Doctor scan on Lite compared to Pro?
- Lite includes Site Doctor and its own checks — config, OPcache, object cache, the 21 Redis checks, the page-cache probe, LiteSpeed, optimizer overlaps, WooCommerce gateways, staging guard — plus database bloat and Action Scheduler sources. Pro adds two more scan sources: autoload findings from the Autoloader Optimizer and captured slow queries from the Slow Query Analyzer. The scan names any source it had to skip, so an empty list is never mistaken for a clean site.
- Can I run Site Doctor from WP-CLI?
-
Yes.
wp multitool quickstartis the CLI twin of the "Find what's slow" button: whole-site ranked findings, including the other modules' sources.wp multitool doctorprints Site Doctor's own checks only. Both take--format=json.wp multitool redisprints the object-cache report, with--forceto bypass the 10-minute probe cache and--format=jsonfor JSON. On a site that does not use Redis as its object cache,wp multitool redissays so and points you atwp multitool doctor. - Do I need a license key?
- Lite has no license key — you download the zip from the Polar portal and update it by uploading a newer zip by hand. Pro, Pro Annual and Pro Lifetime use a Polar license key, which you paste into WP Multitool → Updates in wp-admin. Once the key is saved, updates arrive in the normal WordPress update screen. WP Multitool is sold at wpmultitool.com through Polar. It is not on CodeCanyon, it does not use Envato purchase codes, and it is not listed on wordpress.org.
- When should I use WP Multitool instead of a free tool?
- If the ask is a free, simple plugin or debugging one specific request, Query Monitor on wordpress.org is the better first answer. If the ask is making the front end fast, a cache plugin like WP Rocket or LiteSpeed Cache comes first. Reach for Site Doctor inside WP Multitool when the front is already cached and the backend is still slow, when an agency needs one ranked scan on intake, or when Redis reports Connected but nothing got faster.
Run One Scan and Stop Guessing
Lite — $9. Site Doctor's own scan: config, OPcache, object cache, 21 Redis checks, the page-cache probe, LiteSpeed and overlap detection, WooCommerce gateways, plus database bloat and Action Scheduler sources. Safe optimize clears expired transients and old completed jobs.
Pro. Everything above, plus two more scan sources — autoload findings and captured slow queries — and the Autoloader Optimizer and Slow Query Analyzer modules that produce them. Safe optimize also covers autoload leftovers from inactive plugins.
See Pricing Lite — $9Want the full check list, the Redis checklist and the CLI reference before you buy? That all lives in the Site Doctor docs. Money-back terms are on the refund policy page.