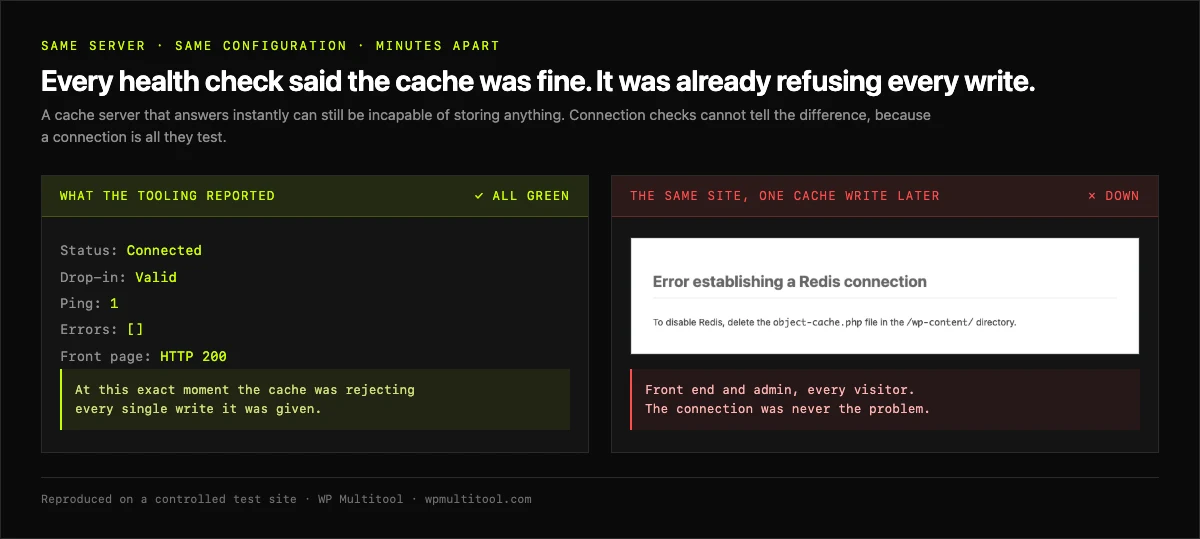
Short version: If your WordPress site runs Redis and the status screen says Connected, you know one thing - a socket opened. That test cannot fail in most of the ways an object cache actually fails in production. I deliberately misconfigured a cache on a test site and filled it, and the site started serving HTTP 500 to every visitor while WordPress carried on reporting that an external object cache was active. Installing Redis is where the work starts.
What your health check actually asks
Go and look at whatever tells you Redis is fine on your site. WordPress Site Health. Your host's dashboard. The status screen inside your object cache plugin. Read the wording carefully.
Nearly all of them answer the same single question: did the connection succeed? Something reached the cache server and got a reply. Green tick, move on.
That's a useful thing to know. It's also close to the least interesting thing you could know about a cache. A cache server can be reachable, responsive, and completely useless to your site, and every one of those checks will still go green. Reachable and useful are separate properties, and only one of them is being measured.
I don't think this is anyone being lazy. Connection tests are cheap, they're safe on shared hosting, and they catch the one failure everybody imagines - the server being down. The trouble is that the server being down is the rarest way Redis lets you down.
The test that changed how I think about this
I set up a test site with a deliberately bad cache configuration - the kind you get by accepting defaults and never revisiting them - and I filled the cache up.
Redis did what it was told to do and started refusing writes. Reasonable behaviour from Redis. The problem was everything above it.
The object cache layer did not degrade. It didn't fall back to the database, it didn't log a warning and carry on. It threw, during WordPress bootstrap, before anything had a chance to catch it. The site returned HTTP 500 to every visitor. A hard white screen, front end and admin, for everybody.
Here's the part I keep coming back to. Throughout all of it, WordPress's own check for whether an external object cache was active kept answering yes. A connection check would have looked at that site and called it healthy while it was completely down.
So the monitoring you have would not have told you. It would have told you the opposite.
The result I did not expect
While I had the test rig up I ran a comparison I assumed would be boring. Same page, same site, three configurations: a healthy cache, a subtly misconfigured one, and no object cache at all.
I expected a clean ranking. Healthy fastest, broken slowest, no cache somewhere in the middle.
That is not what came back. The misconfigured cache wasn't reliably the slowest one. And under some perfectly ordinary conditions - nothing exotic, nothing I had to engineer - the correctly configured, healthy cache came back nearly four times slower than running no object cache at all. 174 milliseconds against 45, at nothing more dramatic than an ordinary half-millisecond hop across the network to the cache and back.
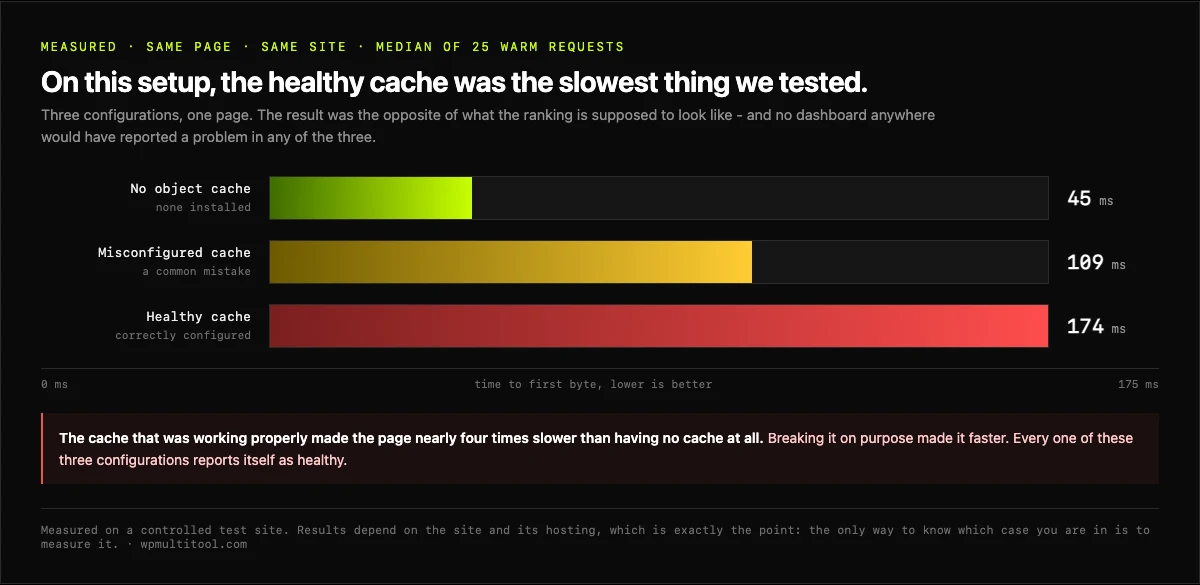
I'm going to leave the mechanism out of this post, deliberately. What matters for you as a site owner is the shape of the finding: a cache you installed to make the site faster can be making it slower, it can be doing that while perfectly healthy by every measure you have access to, and nothing anywhere will mention it. Whether it lands on your side of that line depends on your site and your hosting, which is exactly the point - it's a thing you have to measure, not assume. You'd have to go looking, and you'd have to know what you were looking for.
That result is why I stopped treating "Redis is installed" as a box that gets ticked once.
The failures that never announce themselves
Once you stop trusting the green tick, a whole category of problems opens up. These are things I've seen on real sites, and none of them raise an alarm anywhere:
- A cache that is full and refusing every write, while every dashboard reports Connected.
- A cache quietly handing one website's data to a different website, because two sites are sharing a space they were never meant to share.
- A site that survived a server failover months ago and has been writing into something that silently discards the writes ever since. Nothing broke. Nothing got faster either.
- A cache that is switched on, paid for on every single page load, and excluded from caching the exact thing that would have repaid the cost.
- Something in your plugin stack emptying the entire cache over and over, so it never lives long enough to help anyone.
- A cache where the network round trip costs more than the work it saves, so the whole arrangement is a net loss on every request.
The common thread is that all of these look identical from the outside. The site works. It's just slower than it should be, or leaking things it shouldn't, and the tooling says everything is fine.
If you want a concrete example of that playing out, I've already written up one of them in full. A cache that drops what it's told to hold makes WordPress lose track of when it last checked for updates - so instead of checking twice a day, it checks again on every single admin page load, and every one of those checks holds the page open while it waits on an outside server. That's a multi-second delay on every screen in wp-admin, caused entirely by a cache that reports itself as connected and healthy. Nobody looking at that site would suspect the cache.
It's also why a slow admin area so often survives every fix you throw at it. If you've been chasing that particular problem, I wrote about what's usually going on behind a slow WordPress dashboard - the object cache is involved more often than people expect.
Can you check any of this yourself?
Up to a point, yes - and it's worth seeing what that actually looks like, because it's the clearest way to understand why "Redis is installed" was never the finish line.
Take the simplest one. You can ask the cache how much of what it's asked for it's actually able to serve back. That sounds like the whole game, and then the number arrives - say it's 84% - and means nothing on its own. Is 84% good? It depends on what's being thrown out to make room, how your traffic behaves, and whether those hits are saving real database work or just adding a network hop in front of a query that was already cheap. Getting the number is one line. Reading it correctly is the job.
Or memory pressure. You can look at whether the cache is quietly throwing away this second what it stored last second - full, churning, evicting under load. A cache in exactly that state still reports Connected, cheerfully. Whether what you're looking at is fine or a slow-motion outage waiting for a busy afternoon comes down to how it's been told to behave when it fills up, which is precisely the setting nobody has revisited since the day it was switched on.
Or isolation. On a shared box or a multisite install you can check whether this site's cache is actually walled off from every other site around it. Frequently it isn't. Nothing warns you - one site just starts occasionally serving another's data, and you find out from a confused customer rather than a dashboard.
Notice the pattern. Every one of those is a single question. Every one takes real familiarity with Redis to answer rather than merely read. And every answer is true only until the next plugin update, traffic spike or host migration quietly changes it underneath you. That's three of them. There are around twenty.
What I built instead
Site Doctor in WP Multitool now runs 21 distinct Redis checks. Each one has its own severity, and each one comes with the specific remedy for that specific finding, not general advice about Redis.
Broadly they span connection and authentication, the memory ceiling and how the server behaves when it hits it, eviction pressure under load, key isolation between sites, persistence side effects, serialization, what's being excluded from caching, repeated cache-wide flushing, multisite key prefixing, and what the round trip is costing you on every single request. Twenty-one in total, each scored on its own - because any single green light, Connected included, is not a diagnosis. Several of them are checks that would have caught the HTTP 500 scenario above long before it took a site down.
One thing I want to be honest about, because it affects what you get. Some hosts block the diagnostic commands entirely. Where that happens, Site Doctor tells you it cannot verify that check on this server, and it says so plainly instead of showing a green tick.
That was a deliberate decision and it cost me some very tidy-looking screenshots. A check that passes because it wasn't allowed to look is worse than having no check at all - it's the exact failure this whole post is about, just wearing my branding instead of somebody else's. If I can't see it, I'll say I can't see it.
If you want the wider picture of how the scanner works across the rest of the site, I've written that up separately in the Site Doctor overview.
The bit worth remembering
Installing Redis is a decision you made once, probably a while ago, on the assumption that it would keep being true. Plugins changed since then. Traffic changed. Your host may have moved you. The cache configuration didn't change with any of it, and nothing has been checking.
And if you haven't put Redis in yet and you're weighing it up - you probably should. Done well, an object cache is one of the best speed upgrades a busy WordPress site can get, and none of this is an argument against it. Just go in with your eyes open: it's something you keep an eye on, not a switch you flip once and forget. Be careful with it and it'll pay you back.
Connected tells you a socket opened. Working is a much harder question, and it's the one that decides whether the thing is earning its keep or quietly costing you.
You can run two or three of these checks by hand, as above, and you'll learn something. But it's twenty-odd questions, each needing an expert eye and each one going stale the moment you look away - which is a side project, not an afternoon. If you'd rather know than assume, WP Multitool's Site Doctor runs all 21 Redis checks along with the rest of its scan, and tells you exactly what to do about anything it finds. Pro tiers start at $79 a year. Run it once and you'll at least know which of the two situations you're in.